


One Chart That Speaks 1,000 Words
"We are deep into the phases of the first true 'double-bubble' in modern history."

Not yet a paid subscriber to Herb on the Street and my Red Flag Alerts? Join the growing club, now in the hundreds, who want to avoid the biggest mistake investors make… or just want to understand the concept of risk. You can find out more and how to subscribe right here. If you would prefer to pay with soft dollars, or participate in an upper tier, please contact me directly.
Here’s the chart…
It’s from my pals at the quantamental research firm Kailash Concepts, whose work I often quote for the simple reason: It’s original and not splashed everywhere.
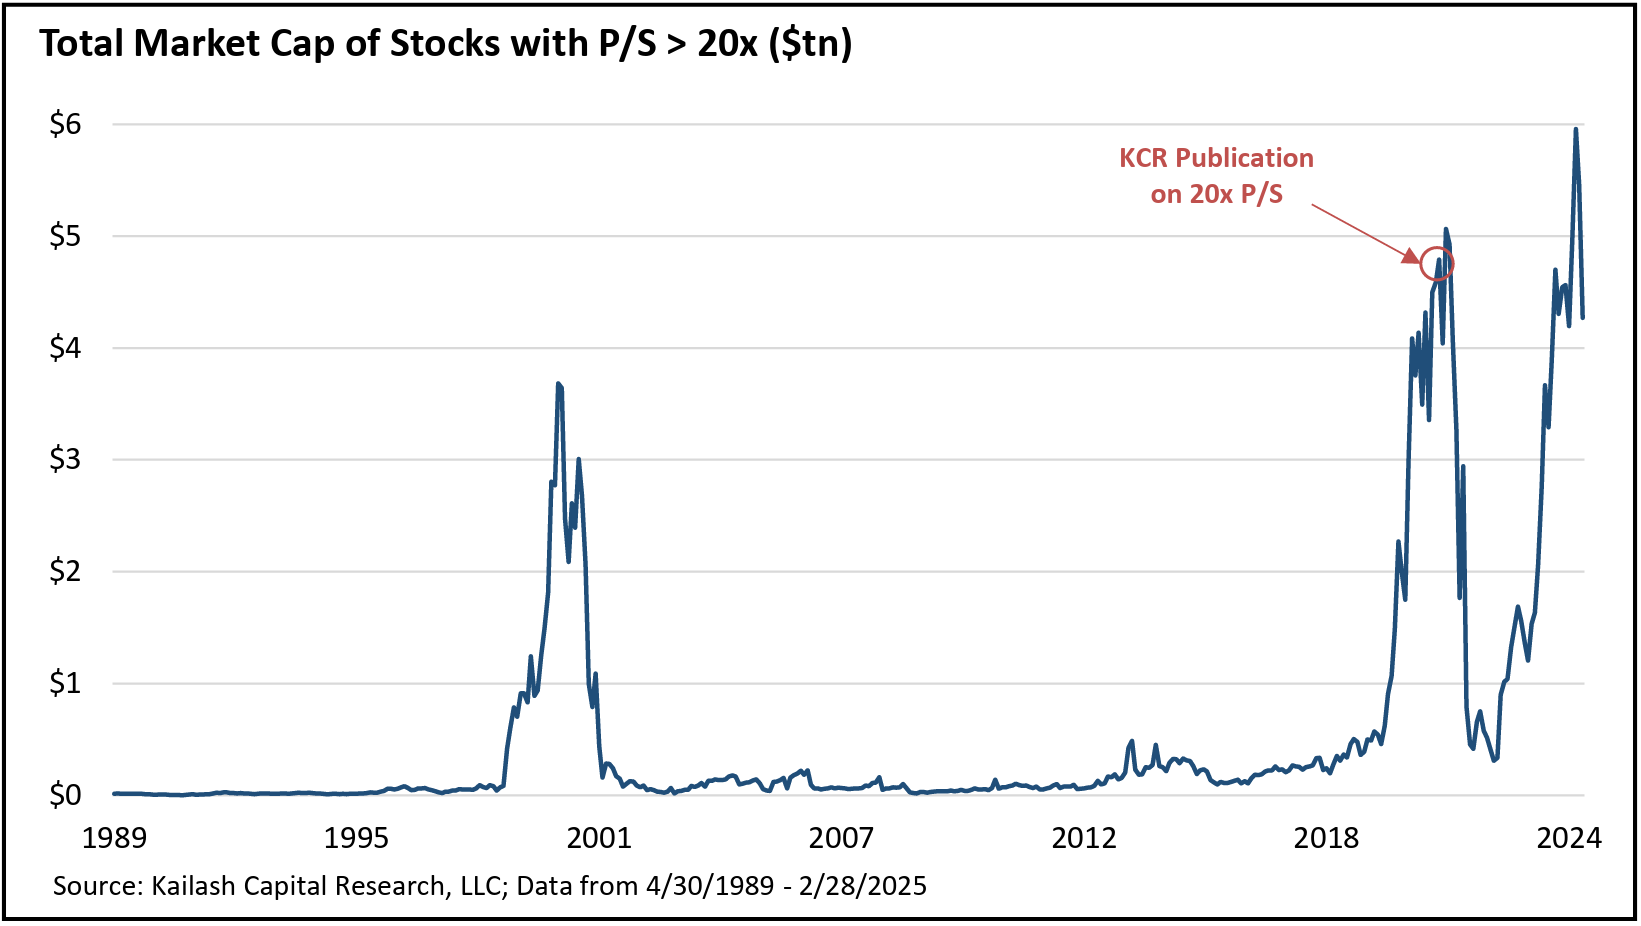
Their latest report is an update of something they wrote in the peak of 2021’s looniness… suggesting the dangers of stocks with crazy price-to-sales ratios. At the time, citing a similar alarm they were sounding, I wrote…
If you missed the not-so-subtle nuance in that chart, the last time they were this disconnected was the dot-com bubble of the late 1990s...
Back then, like now, the name of the game was momentum.
And just as Cathie Wood's Ark Invest funds have risen above the rest during this era, so too did the likes of the Janus Twenty, which plunged in the dot-com crash, before staging a more even recovery. Others, like the PBGH Growth fund, disappeared entirely... PBGH and its parent, Pilgrim Baxter, under a cloud of controversy.
Well… that was then. As they wrote in their latest about the above chart…
You can see on the chart … that we
timed that call perfectlygot lucky.
That’s classically Kailash: having humility in a market increasingly dominated by unbridled hubris.
They’re so so under-the-radar to all but their subscribers and clients that I had never heard of them until a few years ago, when I saw one of their charts posted on social media by someone I follow.
Second Verse, Same as the First
It was a similar chart to the one above, except it showed the percent of all stocks at the tail-end of 2021 with price-to-sales ratios above 10 times…
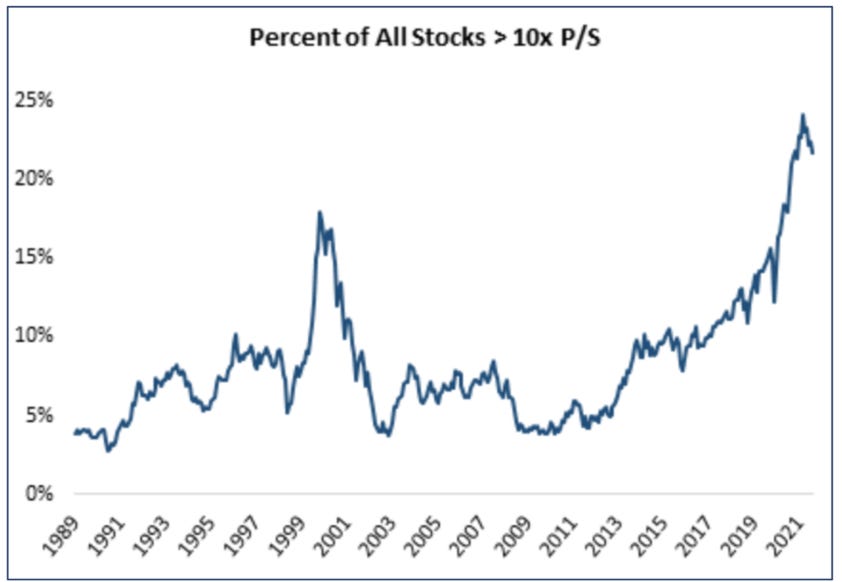
They think things are similar today…
We are deep into the phases of the first true 'double-bubble’ in modern history.
As a reminder: stocks at 10x price to sales have a horrendous track-record for reasons we explain often. Stocks at 20x price to sales? Madness. Last time we highlighted this chart, you can see what happened.
They go on to say…
There is no historical precedent for successful investing at these multiples.
Avoiding stocks trading at these multiples is easy.
The cost of avoiding them is typically emotional as these speculative valuations always collapse.
The risk of embracing speculatively priced assets can be a financial catastrophe.
The data on stocks priced at 20x price to sales is clear: DON’T.
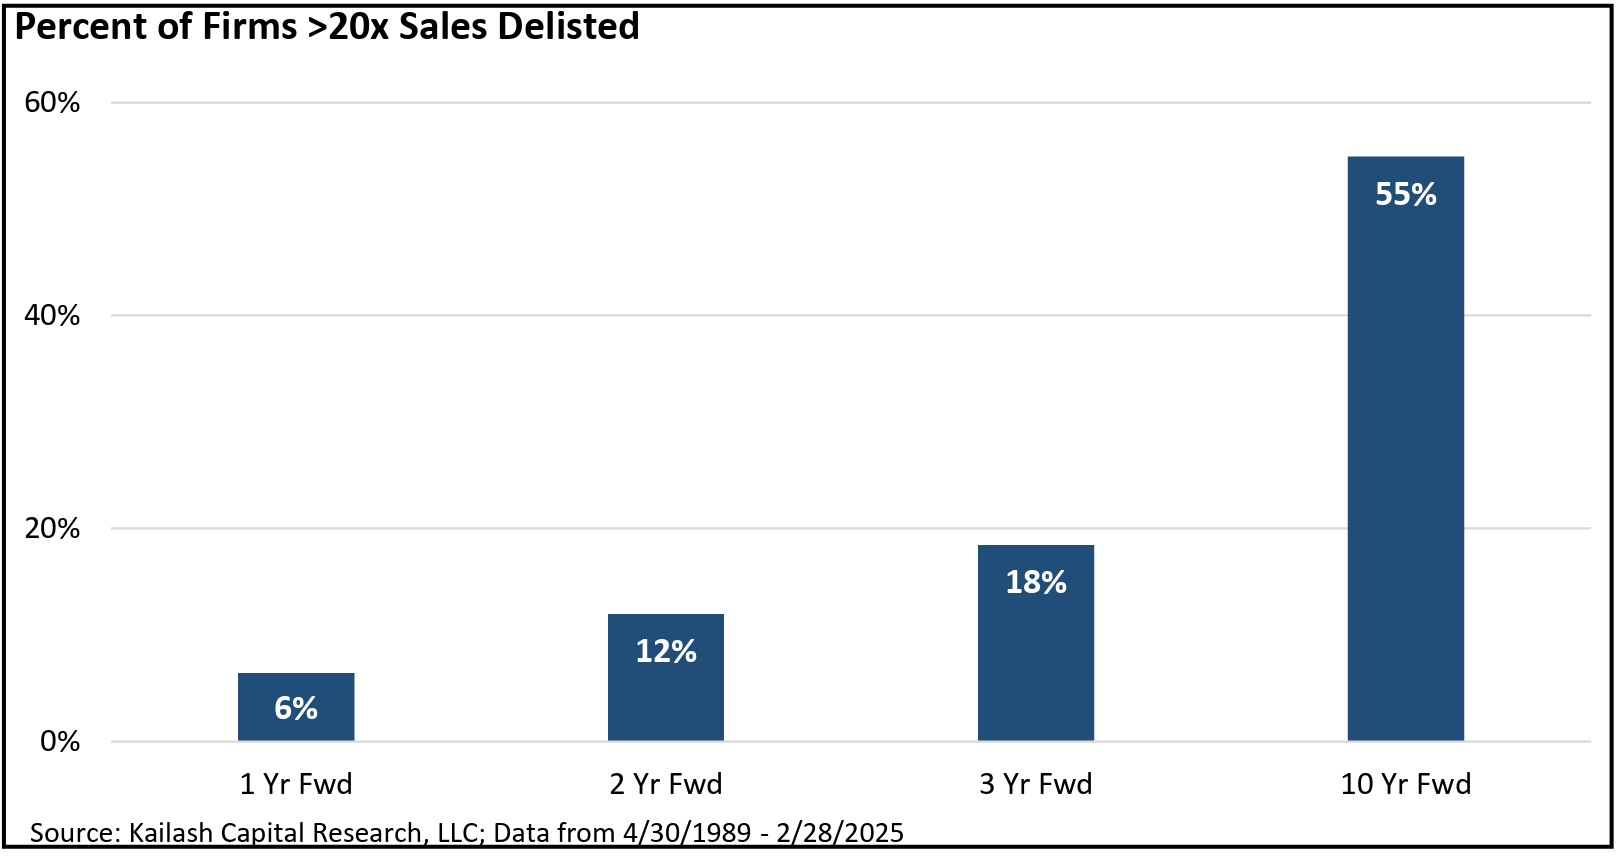
Will They Even Survive?
And while there are certainly plenty of exceptions to the rule, and wind up growing into their valuations – and then some – most don’t.
Or worse, they get delisted! THAT story is in the below chart…
Right now, some of the most egregious among those on Kailash’s bottom-ranked stocks with price/sales of greater than 20x include Joby Aviation JOBY 0.00%↑ at 4510x, Viridian Therapeutics VRDN 0.00%↑ at 4071x and Plantair PLTR 0.00%↑ and SoundHound SOUN 0.00%↑, which is on my Red Flags Focus List, at 59.4x.
Here’s the Kicker…
Kailash’s reason for pointing all of this out wasn’t to call the next crash; instead it’s to highlight a broader thesis to support what they consider to be “rich opportunities” in mid-, small- and micro-caps, which their data (based on their portfolio) shows have substantially better fundamentals and lower valuations. The disconnect is so extreme, that their view is…
Doing the right thing today has rarely been more obvious.
Interpret at will.
You can read the entire report here. Part of it – the really good stuff – is behind a paywall. P.S.: I have no financial relationship with Kailash other than using their data as part of my red flag screening process.
Click the heart if you like like this and feel free to share.
DISCLAIMER: This is solely my opinion based on my observations and interpretations of events, based on published facts and filings, and should not be construed as personal investment advice. (Because it isn’t!) I have no position in any stock mentioned in this report.
Feel free to contact me at herb@herbgreenberg.com.